5 Reporting Dashboards that Can Hugely Impact Your Success
In this brief blog, I will share five Google Analytics dashboards that can have a huge impact on the success of your marketing efforts.
Learn why you should use them, download them (they are free) and say bye-bye to the numerous hours of reporting prep work that prevents you from spending time on more productive and strategic projects.
Why consider using these analytics dashboards?
- They are free,
- They are easily accessible – you can install/uninstall or share them with a click of a button,
- They provide great reporting insights without the need to build your own custom reports and
- They give you all the data you need to make informed decisions and save you significant amounts of time.
1. The Gender Insights Dashboard
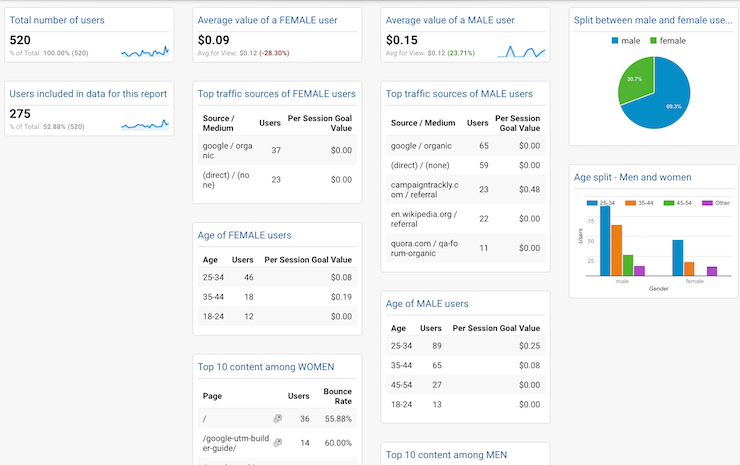
Why it’s great:
- Find out if your audience is mostly men or women.
- If you target women but somehow your site is mostly visited by men, then something might be wrong with your messaging, advertising, or design.
- Find out if you are reaching the right age group.
- If you want to attract male, 25-34 old users and you somehow end up having way too many visitors who are over 35, then you definitely need to review your marketing channels, promotions, and of course… messaging.
- See which age group or gender is more valuable to your business simply by looking at your goal value data.
- Find out which content resonates better with female vs male audiences and take action if your goals are not being met.
- Sometimes, just changing the design of a page alone could sway your users in your favor and convert them. This happened to me – I saw that many male visitors were leaving the home page, which was favored by my female audiences. I created a second page in which I focused on more technical info and bulleted lists – and that worked to retain and engage them.
- Getting your data parsed in seconds and displayed in this wonderful format is priceless. What is more, if you want to share the report – just export it to PDF or email it to your stakeholders.
How to install it:
Make sure you are logged into Google Analytics, then just click here to get your gender dashboard.
2. The Goals by Channel Dashboard
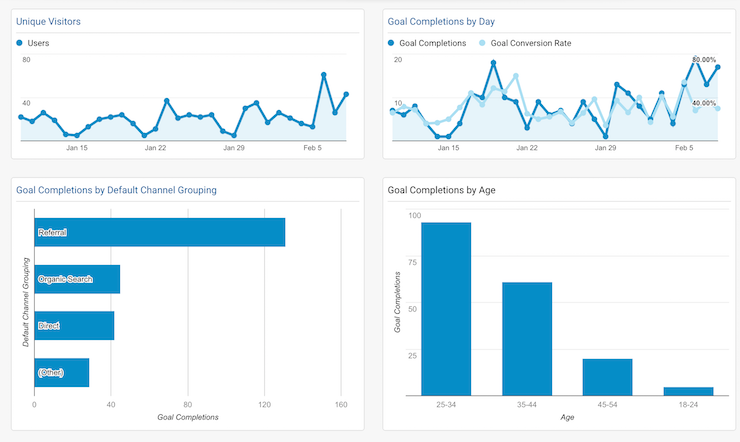
Why it’s critical to your success:
- Use this dashboard as your centralized conversion performance report and keep track of your goals daily, monthly or as often as you like.
- identify patterns, trends, and take immediate action if your performance suddenly suffers.
- The report shows you your top converting channels and your top converting audience broken down by age.
- Additionally (yes, it provides a lot more info than shown in the image above) it gives you:
- which pages contributed to your goals, plus top performing content assets
- which cities generated the largest number of goal completions
- mobile phone versus desktop performance, and more.
How to install it:
Make sure you are logged into Google Analytics, then just click here to get your goal conversion dashboard.
3. The Cross-Device Reporting Dashboard
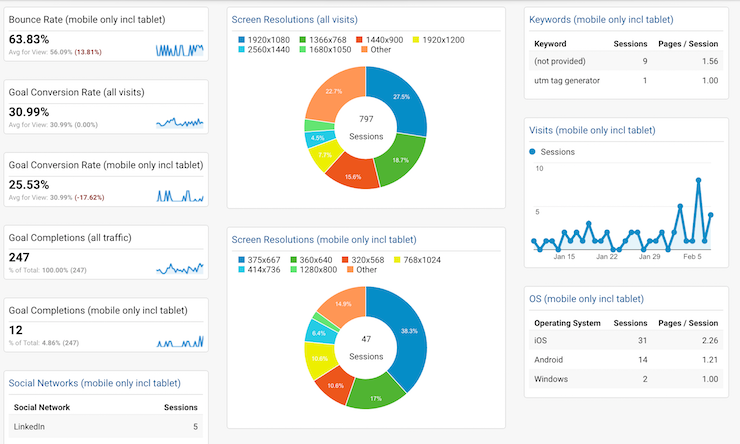
Say hello to the age of multi-device experiences and multi-size screen resolutions. This eye-opening dashboard can tell you so many things about your audiences and your web performance:
- Look at the diversity of devices and screen sizes here. And if anyone complains that there was a bug on your site or that a banner looked a bit skewed, just show them your dashboard and tell them that if there’s only one bug, then you are a true super-hero.
- It’s never been more critical to have a consolidated view of how your website performs across tablets, desktops, and the various mobile products available on the market.
- this is so important on so many levels as it touches areas including look and feel, overall user experience, and alignment with targeted user demographics that can make or break a marketing promotion.
- While my mobile visits, for example, have much to be desired in terms of numbers, it is surprising that my goal conversions are not bad at all, although the recent drop in performance (by 17%) must indicate that something somewhere might not be in perfect alignment and needs to be investigated further.
How to install it:
Make sure you are logged into Google Analytics, then just click here to get your cross-device dashboard.
4. The Social Media Dashboard
For those of you who are struggling to prove Social Media’s value for your organizations – do make sure to check out this dashboard.
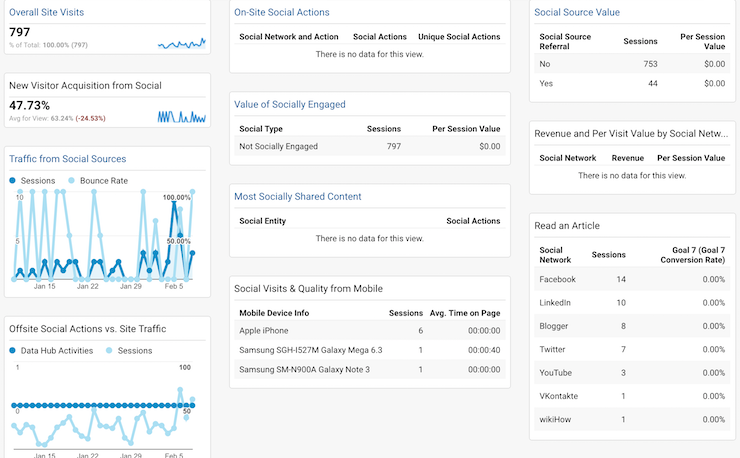
- Although not as pretty as the ones featuring colorful pie charts and pretty graphs, this report has a lot to offer to the busy social media marketer.
- Without spending too much time, you can get a very informative snapshot of your social performance at any moment in time.
- View the percentage of new visitors coming from Social. Depending on whether you are using it to build the top of your funnel or to retain existing customers, you can cross-check immediately if you are achieving your goals.
- Identify the (per-session) value of your social visitors,
- Track your revenues (this section is empty in my report because I don’t use social for direct sales),
- Evaluate the quality of your traffic, as well as top social network visitor and goal completion drivers,
- Check social visits from mobile, and so much more.
How to install it:
Make sure you are logged into Google Analytics, then just click here to get your social media dashboard.
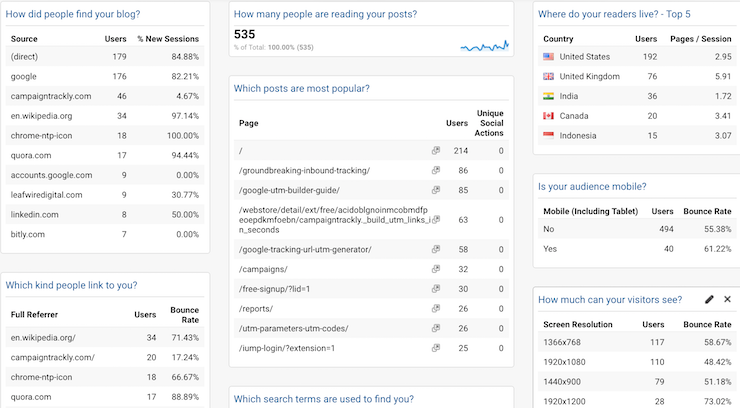
5. The Blog Performance Dashboard
Bloggers, here is a super-simple dashboard that not only saves you a lot of time but also provides simple and clear-cut metrics that can help you get to know your readers and their preferences.
- Find where your readers live.
- Identify your top blog posts and see how many times they have been shared across social networks (this component has not been activated in my dashboard)
- View the websites that link back to you
- Uncover which screen resolution makes it most difficult for your readers to enjoy your blog and take action to correct that.
How to install it:
Make sure you are logged into Google Analytics, then just click here to get your blog performance dashboard.
Conclusion
As promised, I shared with you five dashboards that have really made a difference for me and my clients. Let me know if this was useful, or feel free to share the dashboards that you love and use. Over to you.