
A secondary dimension in Google Analytics (GA4) is just a fancy way of saying “a second way to sort your data.” Think of it like sorting your LEGO bricks first by color (Primary), and then by size (Secondary).
What is a Primary Dimension in Google Analytics?
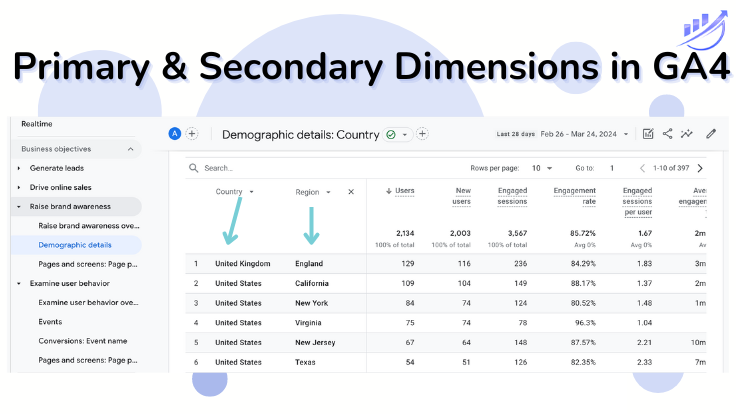
Imagine you want to see which countries your website visitors are coming from. You would look at the “Country” list. In GA4, “Country” is your primary dimension—it is the main category you are looking at.
What is a Secondary Dimension in Google Analytics?
Now, imagine you want to dig deeper. You know people are visiting from the USA, but you want to know which cities they are in.
By adding a secondary dimension called “City,” your report will now show you both: the Country and the City at the same time. It helps you see a much clearer picture of who is visiting your site.
What is Secondary Dimension in Google Analytics 4
Examples: How to Use Primary and Secondary Dimension Together
When you are tracking your marketing links (UTMs), here is how the names change when they get into Google Analytics:
| The Link Tag (UTM) | Primary Dimension (The Main Group) | Secondary Dimension Example (To drill down) |
|---|---|---|
| utm_source (e.g. Facebook) |
“Session source” | Add Device to see if Facebook users are on Mobile or Desktop. |
| utm_medium (e.g. Email) |
“Session medium” | Add City to see which town’s people open your emails the most. |
| utm_campaign (e.g. Summer_Sale) |
“Session campaign” | Add Landing Page to see where the Summer Sale link sends people. |
Want to see every category available? Check out the official Google list here.
Metrics vs Dimensions in GA4
It is important to understand the difference between dimensions and metrics.
Dimensions are the “WHO, WHERE, or HOW”:
- Who visited? (User Type)
- Where are they? (City)
- How did they find us? (Source/Medium)
Metrics are the “HOW MANY”:
- How many people? (Total Users)
- How many minutes did they stay? (Average Engagement Time)
- How many pages did they look at? (Views)
Watch This GA4 Tutorial:
Learn More About the UTM_Medium Dimension in Marketing Campaign Reporting:
Dimensions vs. Metrics: What's the Difference?
- Dimensions (The Labels): These are categories or names. If you can't add it up in a calculator, it’s probably a dimension.
Examples: "Country", "Browser", "utm_campaign". - Metrics (The Numbers): These are things you can count. If you can find the average or the total, it’s a metric.
Examples: "Total Users", "Bounce Rate", "Number of Clicks".
Pro Tip: You use a Dimension to group your data, and a Metric to see the score of that group!
⚡ Quick Quiz: Are you a GA4 Secondary Dimension Pro?
Test your knowledge! Can you guess which one is which?
Click to see answer
Dimension! It’s a category (Source).
Click to see answer
Metric! It’s a number you can count.
Click to see answer
Secondary Dimension! You added it to the main list to see more detail.