

This blog discusses why you need to use a campaign ROI calculator to measure your performance. It also shows you how to use the ROI calculator embedded at the end of the post. Additionally, it offers a free Marketing Excel ROI Calculator template that will calculate your marketing campaign success versus budget spend in a few easy steps.
Why and When to Use a Marketing Campaign ROI Calculator
Using a marketing campaign ROI calculator offers a quick and easy way to run through potential success scenarios at any stage of your campaign development and implementation.
Getting in the habit of using calculations to estimate the potential value of your impending marketing initiative is a good thing, for three reasons:
- It sets you in a data-driven mode, helps you focus better on the task at hand, and eliminates much of the planning and resource guesswork, associated with ideating and designing marketing campaigns.
- It helps you be factual and value-driven in managing stakeholder expectations. And stakeholders do appreciate a numbers-driven approach because it removes ambiguities and facilitates alignment. It’s much easier to focus on results when everyone is on the same page.
- It empowers you to see the end game. And that clarity helps tremendously when you are looking for budgetary or any other type of support from relevant decision makers.
At the end of this article, you can find a very simple interactive ROI tool that I built using a simple Javascript setup, courtesy of https://jscalc.io.
I also have an extended MS Excel version of the ROI calculator that covers multiple digital marketing channels, enabling you to plan your marketing spend smartly so that you can maximize your campaign returns.
A link to download the Marketing Spend ROI Calculator workbook is available under this video. The excel spreadsheet is designed to enable you to automatically calculate your budget spend and ROI in a few simple steps.
Watch this 30-second video to see the excel spreadsheet in action
[youtube width=”100%” height=”100%” autoplay=”false”]https://youtu.be/7RvhyD512_U[/youtube]
Fill out this quick form to download our Marketing Spend ROI Calculator workbook here:
Campaign Metrics that Showcase the ROI of Your Social and Digital Marketing Initiatives
Many Social Media and marketing campaign managers are under pressure to demonstrate how their efforts are contributing to the success of their company by providing meaningful outputs and KPIs that make sense to everyone in the enterprise.
As a result, they are no longer focusing on showcasing seemingly intangible, vague, and out-of-context metrics, such as “Likes”, “Shares”, and “Mentions”.
Instead, they are trying to present a more coherent picture that offers a direct link between marketing campaigns and vital business success indicators including customer acquisition and retention.
What metrics you use to quantify the results of your social media or digital marketing campaign efforts and how you use them very much depends on what types of campaigns you are running. If you are focusing on driving users to a landing page which offers newsletter subscriptions, then you will probably measure:
- the size of the traffic that your campaign created
- the number of emails you collected
- the number of referrals you sent to other company pages
- the opportunity you left on the table (bounces, non-conversions, exits).
If you are driving downloads for gated content, such as whitepapers or eBooks, then you will be reporting on the number of online form-fills and document views that your Twitter or LinkedIn tactics brought to the table (and so on) instead of emails.
2 Must-have Elements You Might Want to Consider When Setting up Your Reports
- In addition to the metrics above, it would be of key importance to compare your results to a “control group” in the form of industry KPI’s or past company successes.
Reporting the outcome of your campaigns without a point of reference won’t be very helpful in establishing whether your performance is ok, great, or phenomenal. And as a rule of thumb, every decision maker will ask you to provide some sort of KPI validation, so it’s always healthy to be prepared for that conversation with some good data and relevant context for it.
- Another thing to consider is that if you are covering only the marketing metrics mentioned above, without going any further than that, you are focusing only on the immediate outcome of your campaign.
You are reporting only a partial outcome that makes it difficult to gauge the real value of your efforts. Which means that you are missing out on the chance to shine a bright light on the bigger picture – the impact that your campaign has on driving new or repeat business for the company.
Because Marketing’s ultimate business goal is to attract, generate, and retain customers, reporting how every campaign creates value for the bottom line is what this is all about.
When in Doubt, Use a Campaign ROI Calculator
And here is when a simple marketing campaign ROI calculator like the one below might be of tremendous help. What it does, is focus on the entire marketing and sales funnel, covering the expected outcomes of your buyer’s journey within the context of your campaign.
It gives you a ready-made template that makes it easy to stay focused on the end goal. It lets you play with different values and scenarios, so you can get a ballpark on what inputs you need to prepare to deliver the results that are expected of you.
Why this is great – because you start your planning process by defining how many sales deals you want to achieve as a result of your campaign and then work backwards from there to estimate what you will need to do to hit those numbers. Easy and transparent for production and resource planning purposes, too.
Here is how to use the free interactive marketing campaign ROI calculator that you will find below:
I used Twitter as an example, but it can be easily replaced with any of the channels you are using. Trust me, it’s a lot easier and simpler to use it than it looks – all you need is to enter a few numbers, details below:
- Use the Inputs column to enter the following data:
- Total Campaign Tweets – how many tweets do you intend to post for the duration of the campaign – 50, 100, 200? If your campaign lasts for 30 days and you plan to push 2 tweets a day, then your total tweet number is 60.
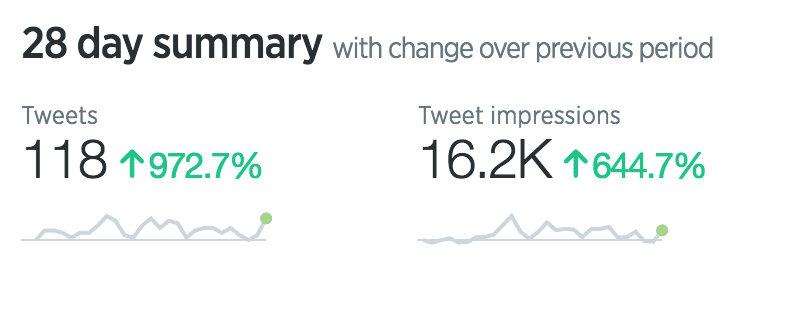
- Average Views per Tweet – this data is already available in your Twitter Analytics account. Just see how many tweets you had in the last 28 days and how many total views they generated. Total views divided by the total number of your tweets for the period equals your average views per tweet.
- Ave Twitter Click Through Rate – this data is also available in your Twitter account. You can calculate it by using this formula: the total clicks for the reporting period divided by the total views or impressions. If your average CTR is 1.6%, you will need to enter 0.016.
- Campaign Page Conversion Rate – most of the time, the tweets will drive the users to a landing page that contains the campaign offer. That’s why this simple calculator does not cover Twitter cards. It’s important to know that conversion rates vary by industry. Page quality and stickiness matter too. Look at your analytics tool to gauge what your average conversion rate is. A 4% conversion rate, for example, will be entered in the calculator as a decimal number – 0.04.
- Average Sales Accepted Lead Rate – if you provide Sales with 100 leads on a monthly basis and they routinely qualify around 40 of them as “accepted”, the average accepted lead rate is 40% and you will need to enter 0.4 in that field.
- Average Sales Close Rate, in this case, it shows the number of customers that get acquired as a result of the leads that were accepted by the Sales team. If they convert every 5 out of 10, then your number is 0.5 (50%).
2. What you will get in the Outputs column:
- Your total number of Tweet views for the life of the campaign. (Total Campaign Tweet Views)
- Play around with your inputs to see various potential traffic size scenarios and what it will take to increase your visits. (Total Campaign Visits from Twitter)
- The Campaign Total Twitter Form Fills field will show you your total number of expected form-fills that will come from this specific initiative.
- How many leads will be potentially accepted by Sales as a result of this campaign (Campaign Total Sales Accepted Twitter Leads)
- The last field shows you how many customers will be acquired as a result of your marketing efforts.
Give the Interactive Marketing Campaign ROI Calculator a Try
Hope the above calculator was of help. Happy to chat some more about it if you have comments or questions. Contact me on Twitter, Linkedin or by emailing me at milena@leafwiredigital.com.
[/fusion_text][/fusion_builder_column][/fusion_builder_row][/fusion_builder_container]


